

The Tranching Mechanism
Every Royco market begins with a single strategy base asset. Contracts govern how strategy returns and losses flow back to the different tranches. The fundamental mechanism: Junior capital provides first-loss coverage for Senior capital, while SLP provides liquidity. The protocol enforces a minimum amount of JT capital (the Coverage Ratio) and SLP capital (the Liquidity Ratio), respectively, that must stand behind every dollar of ST deposits. If either minimum is not met, new ST deposits are not accepted and yield is redirected to JT and SLP to incentivize enough capital to come in and restore the proper ratio. Both ST and JT capital are deployed into the same base asset. The difference is that JT also earns a risk premium for providing first-loss coverage, and in exchange, JT absorbs losses. SLP is not directly deployed into the same base asset. Instead, it is deployed into a rate-scaled AMM pool made up of StT tokens and the market’s configured quote asset. ST holders can use this pool as a secondary exit route, with the resulting price discrepancies creating arbitrage opportunities that maintain the pool’s peg. Pool Example Suppose a market is deployed on top of a USDC lending strategy yielding 8% annualized:
Coverage is measured on the JT + ST pool: $2M JT / $10M (JT + ST) = 20% coverage. Coverage of 20% means JT can absorb up to a 20% drawdown on the $10M pool before ST is affected.
Liquidity is measured against ST: $2M SLP / $8M ST = 25% liquidity. This sizes the SLP’s market-making depth to an amount equivalent to 25% of Senior’s value, in the pool as exit depth behind ST shares.
Loss Scenarios
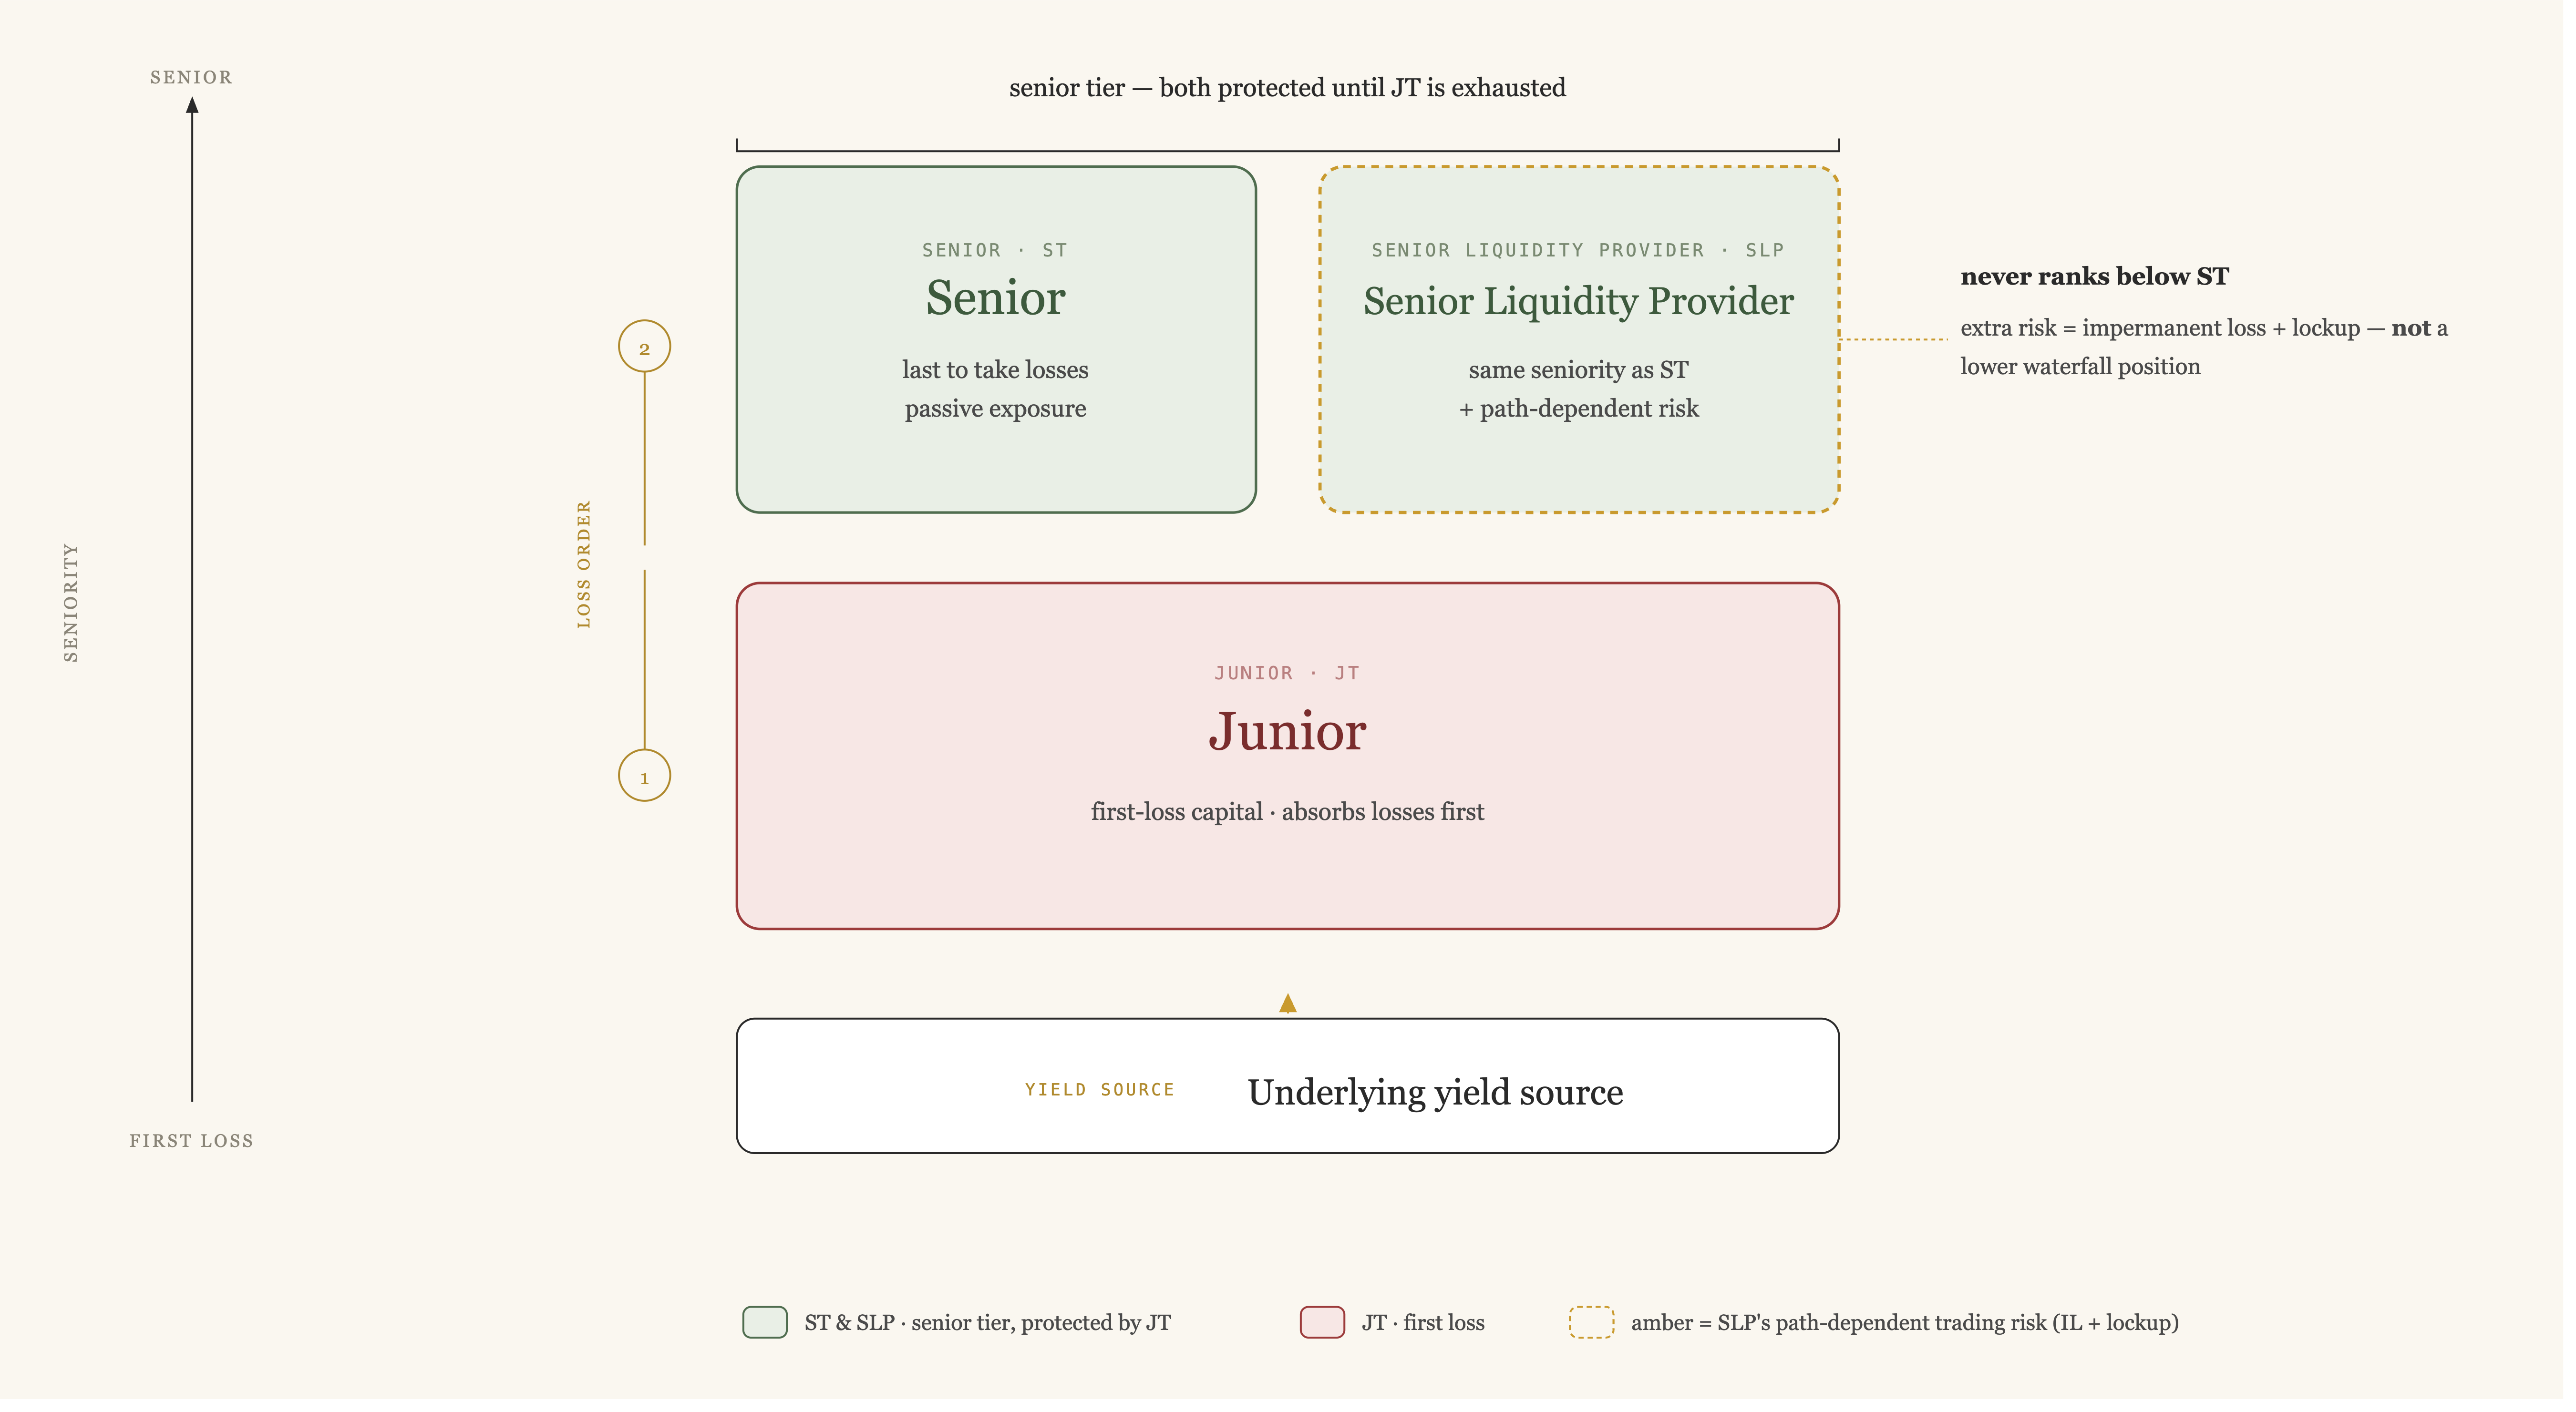
Coverage Requirements
Royco enforces a minimum coverage requirement for each market. Coverage represents the maximum percentage drawdown the underlying can experience before ST capital is affected. It is a hard constraint: if coverage falls below the minimum, JT absorbs the loss and coverage is consumed. New ST deposits and Junior withdrawals will be paused until JT capital returns to the required level. ST depositors are shielded by the JT buffer, and are able to exit via the SLP. The minimum buffer is smart-contract-enforced, so Seniors know the transparent, market-specific protection threshold. Coverage minimums are set per market by pool creators. The minimum coverage requirement is calibrated individually for each market based on its individual risk factors.Liquidity Requirements
Royco also enforces a minimum liquidity requirement for markets with liquidity functionality enabled. The liquidity requirement reflects the size of the AMM pool available for ST to exit into. If liquidity falls below the minimum, new ST deposits and SLP withdrawals will be paused, similar to the coverage mechanism.How Yield Is Split
In every Royco market, the Yield Distribution Model (YDM) decides how base asset returns are divided between the tranches. Yield distribution between tranches works similarly to lending markets. Two premiums are paid out of ST yield: a Risk Premium to the JT and a Liquidity Premium to the SLP. The two are constrained together so that the risk premium plus the liquidity premium never exceeds 100% of ST yield.Coverage utilization → Junior’s risk premium
Coverage utilization measures how much JT capital is currently backing ST exposure. For example, if the market needs $1 of JT coverage and there is exactly $1 of JT capital, utilization is 100%. If there is $2 of JT, it is 50%. When JT capital is scarce, more yield flows to JT to attract more first-loss capital. When JT capital is abundant, more yield flows to ST. The pool rebalances toward equilibrium based on where each side wants to deploy. The protocol targets 90% utilization as the equilibrium point:- Senior depositors need the 10% buffer. At 100%, the market closes to new Senior deposits because there’s no Junior left to back them.
- Junior depositors need utilization high enough that their boosted yield is meaningful. At low utilization, Junior’s premium gets diluted across the pool and the risk isn’t sufficiently compensated. At 90%, Junior earns real extra yield, and the curve steepens aggressively above that point; so when coverage gets tight, new Junior capital is strongly incentivized to show up.
Liquidity utilization → the SLP Tranche’s liquidity premium
Using the same model, liquidity utilization measures how much required secondary liquidity the SLP is providing. When secondary liquidity is scarce, more yield flows to the SLP through the liquidity premium in order to attract capital. When liquidity is abundant, more yield stays with the ST. The same 90% target applies, for the same reasons:- Senior depositors need secondary liquidity so their shares remain tradable. At 100%, the SLP is exactly at its floor, and the market stops accepting new ST deposits to avoid exceeding available liquidity.
- SLP depositors: At low utilization, the premium fails to sufficiently compensate the capital commitment. There is a tail risk at exceptionally low utilization where SLP depositors may underperform the baseline Senior yield. However, at a healthy utilization, the SLP earns meaningful extra yield, with the curve steepening above that point to incentivize new market-making capital.
Each curve is bounded by a maximum spend, expressed as a % of Senior yield. The two curves’ maximums combined never exceed 100% of Senior yield. Below 90%: essentially flat. Y0 and YT are close together. When JT or SLP capital is plentiful, excess supply already dilutes their returns. Above 90%: steep. Y100 is typically set notably higher than YT , meaning that as capital becomes scarce, the yield share ramps aggressively to attract new depositors. Y100 is set per market such that at 100% utilization, the resulting JT or SLP yield is attractive enough to draw in new capital. Self-Adapting Yield Curve Over Time Adaptive YDMs adjust their pricing curves to market conditions over time. When a tranche’s utilization runs above target, its curve shifts up to attract more capital. When utilization sits below target, the curve shifts down. The further from 90%, the faster the adjustment. These shifts happen gradually, over days or weeks. The result is a self-balancing system. If JT or SLP capital leaves, utilization rises for that tranche and the premium increases. If ST capital leaves, the opposite happens, allowing the market to find its own equilibrium. What Depositors See The APY shown on the interface is the trailing APY, the annualized rate from actual yield accrued over the stated duration. If utilization shifts or capital enters or exits the pool, future yields will differ.
- Y0: at 0% utilization
- YT: at 90% (the target)
- Y100: at 100%, the maximum spend
Observation Period
Yield sources sometimes experience short-term drawdowns; temporary dislocations, oracle lag, or brief liquidity events that reverse within hours or days. The Observation Period lets the market observe whether a drawdown is sustained before allocating any loss to JT capital. When a drawdown is detected by an accounting sync, the market automatically enters the Observation Period. Seniors can no longer deposit or redeem directly via redemption, new JT deposits/redemptions, and SLP redemptions are blocked, and 100% of any base-asset recovery is applied to restoring JT until its outstanding loss is fully recovered. However, ST holders are not locked into their positions. The SLP continues to provide secondary liquidity throughout the Observation Period, allowing ST holders to exit by selling ST shares into the SLP AMM pool at the pool’s current price. The protocol then observes a defined time window per market. If the strategy recovers within that window, no loss is realized. If the drawdown persists beyond the window, it is treated as a genuine loss and permanently allocated against JT capital. If the drawdown is severe enough to reach the market’s Protected Exit Threshold before the window expires, JT losses are finalized immediately, and ST gains the option to withdraw. The Observation Period window is set per market. Some markets may define a 7-day window; others 30 days; some markets may define a window of 0 days, in which case losses are finalized immediately upon detection with no observation period. The specific window for each market is displayed on its market page in the protocol interface. If a deployer chooses, they can configure an Observation Grace Period; a period after deployment where an Observation Period is blocked from triggering. This period exists in order to allow creators and liquidity providers to smoothly bootstrap liquidity, rather than being subject to market fluctuations causing a freeze.Protected Exit
The Protected Exit allows ST depositors to safely withdraw their base assets at fair value when a market drawdown breaches a pre-configured threshold. If a strategy suffers a markdown that breaches this Protected Exit Threshold, the Observation Period is terminated and ST can withdraw their assets, subject to the EntryPoint’s configured settlement delay. This realizes losses against JT capital. Those who believe the remaining JT buffer is sufficient can choose to stay. If losses exhaust JT capital entirely and the user has not withdrawn, their ST position becomes directly exposed to further drawdowns. Senior’s exits are complementary: the SLP pool gives an instant exit at the pool’s current price. During an Observation Period, primary redemption of the underlying becomes available again once a drawdown breaches the Protected Exit Threshold.Protected Exit Bonus
Some markets may include an optional configuration called Protected Exit Bonus. When the Protected Exit Threshold is exceeded in a market with Protected Exit Bonus enabled, any Seniors who withdraws may receive a Bonus % (up to the market-defined %) for withdrawing. This is designed to assist ST in unwinding their positions, and help restore the market into a healthy state. The Bonus is sourced from remaining Junior capital. Example: A market has Minimum Coverage = 10%, Protected Exit Threshold = 5% and Protected Exit Bonus = 2%. The base asset drops below 5% coverage remaining, breaching the threshold. Alice (Senior, $100k) chooses to exit. She receives her $100k back plus up to a $2k bonus from Junior capital: a reward for helping restore the market to a healthy state. Seniors who stay forgo the bonus.This document is provided for informational purposes only and does not constitute investment advice, a solicitation, or an offer to sell any securities or financial instruments. Participation in Royco products involves risk, including the potential loss of all capital deployed. Prospective participants should conduct their own independent due diligence and consult with qualified legal, financial, and tax advisors before making any investment decisions.